Introduction to Google Analytics 4 (GA4) export data in BigQuery
Introduction to the basic concepts of Google Analytics 4 (GA4) export data in BigQuery.
This article is an excerpt from the original piece I posted on Medium in 2020, but still relevant for beginners. You might see some references to App+Web, this was the working title for Google Analytics 4.
The future of app and web analytics is here: Google announced a new way of measurement in Google Analytics. While still in beta, this is a small revolution for web and app analytics.
Free at last!
One of the most promising features in the new version of Google Analytics (GA4) is definitely BigQuery linking. All GA4 property owners can now enable the data export to BigQuery and start to utilise the raw event data collected on their website(s) and app(s).
In the previous version of Google Analytics (Universal Analytics) this integration was only in scope for GA360 enterprise properties. In GA4 the data export is free for everyone to use, you only pay for the actual data storage and data querying when you exceed the limits of the Google Cloud free tier. Your credit card will only be charged after 1 TB of querying per month and 10 GB of storage).
You can also use the BigQuery sandbox environment without a credit card, but then you'll risk your data tables to expire after 60 days.
Why should you enable the BigQuery linking for GA4?
I can think of a couple of reasons:
- store your data in BigQuery (Google Cloud) and/or send it to your data warehouse in other clouds like AWS, Azure or Snowflake
- join and enrich your data with other marketing/crm/contextual data
- visualise your data in tools like Data Studio, Tableau, Looker or PowerBI
- perform advanced analysis on your data
- leverage your data as input for (machine learning) models
So let's make sure we start sending data right away, as there is no backfill for historical data we already collected in GA4.
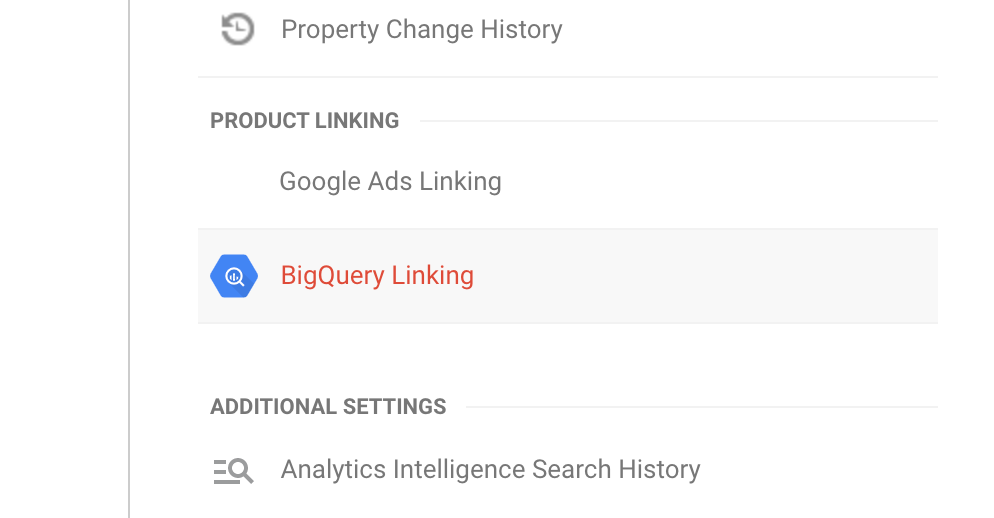
Here is how you link Google Analytics 4 to BigQuery:
On this platform I will focus mostly on web data. I will show you how to calculate new GA4 engagement metrics, but also how to replicate the Universal Analytics dimensions and metrics that you won’t find in the GA4 user interface anymore. But beware…
This is not Universal Analytics. Try to look at the new measurement model as an opportunity to go beyond what Universal Analytics ever could, rather than just another way to populate GA’s ancient data model. (source)
If you are new to BigQuery, I recommend reading watching some introduction videos on BigQuery first.
What is going on?
Krista Seiden, former Analytics Advocate at Google, explains in a series of blogs why the new Google Analytics 4 property is a big step forward:
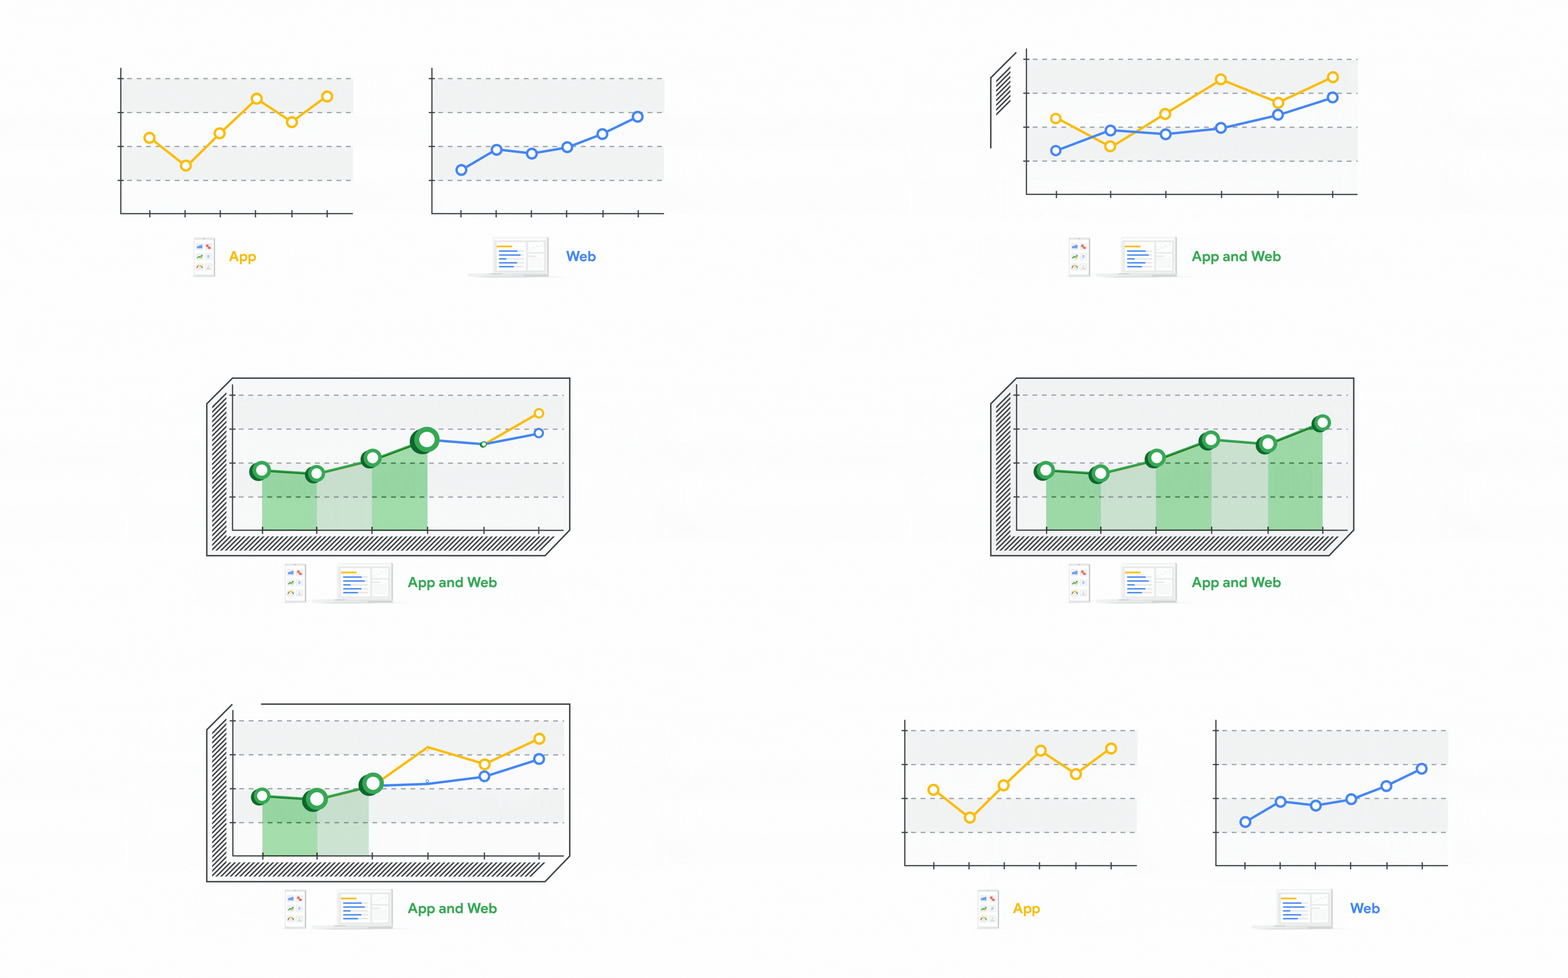
Currently, if you have both app and website data, you are collecting and analyzing that data separately, in Google Analytics for the web, and in Google Analytics for Firebase for apps. While the platforms differ, many of the KPIs and business needs when it comes to understanding data and reporting are the same, so it’s time to bring this data together in one Analytics property! (source)
This development has severe implications on the way data will be collected and analysed.
This new type of measurement uses the same data schema as Google Analytics for Firebase (GA4F) (…) The most important thing to know about this new data schema is that it moves away from the traditional Session + Pageview method that classic Google Analytics has used for 15+ years. Instead, it uses an Event + Parameter model. It’s different, but it opens up a whole new world of possibilities in terms of what you can track, and all of the additional details you can add to each event action via the associated parameters. (source)
Resources
If all this is new to you, please read all about GA4 properties before proceeding with the queries.
New engagement metrics
In the the Google Analytics 4 property we see some new metrics that were not available earlier:
Engaged sessions
The number of sessions that lasted longer than 10 seconds, or had a conversion event, or had 2 or more screen or page views. (source: definition in GA4 UI)
Here is some background by Krista Seiden:
The idea of an engaged session stems from wanting to remove bounces from the session count, therefore, an engaged session is only counted as such after the user has been on site for 10 seconds. If they leave before then, it will count as a bounce but not as an engaged session. (source)
And Florian Perl adds:
This is more or less opposite of Universal Analytics Bounces. An Engaged session is one with at least 2 pageviews, or a pageview + an interaction, or 1 pageview with 10-second duration. The 10-second timeout cannot be changed, for now. (source)
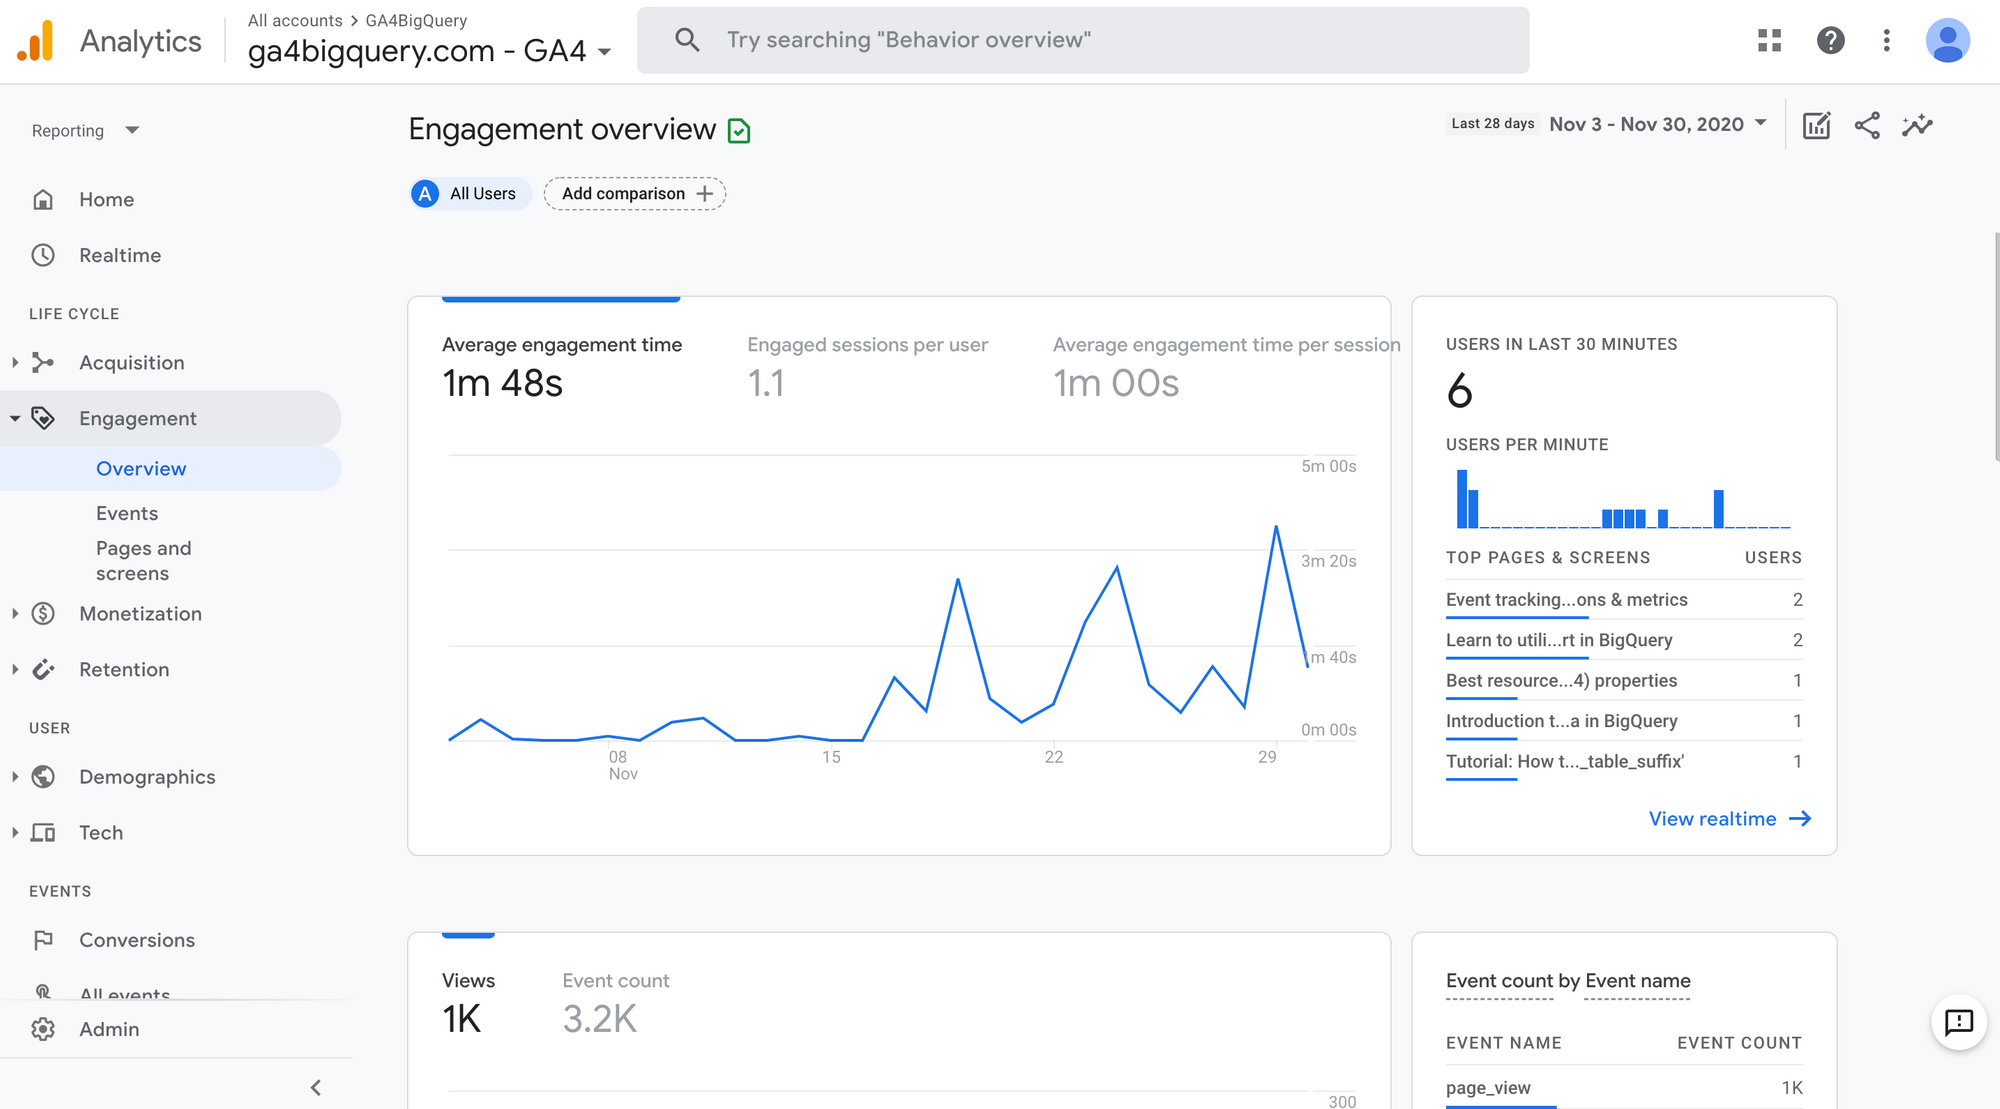
Engaged sessions per user
Number of engaged sessions per user, so if we see the same user ID coming back multiple times, this may be 3, 4, or 5 sessions per user, then averaged out over your total user count, giving you an average above 1, with the actual number dependent on how many new vs returning users (or deleted cookies) your content has. (source)
Engagement time
This one is perhaps my favorite new metric. Why? For years, I’ve been talking about why I hate the metrics ‘Bounce Rate’ and ‘Time on Page’ in Universal Google Analytics. There is good reason for this dislike: the metrics are flawed in how they are calculated due to how the use of the web has changed since the inception of these metrics more than 15 years ago. (…) In Google Analytics for Firebase, there is a metric called ‘Engagement time’, which I like much better because it is calculated as the actual time in foreground for the app which is much more reliable than ‘Time on Page’ in Universal Google Analytics.
For A+W, we wanted to bring a similar logic, but due to how browsers and tabs work, that is much harder. Our small team spent quite some time debating on the best way to calculate a metric that would be meaningful for analysis, and eventually came to ‘Engagement time’ for web which is meant to be synonymous with how it’s calculated in app, using some new handlers to closely follow the tab in foreground, screen sleep time, etc. Essentially, a much better calculation of time on page. (source)
Engagement rate
The percentage of engaged sessions (Engaged Sessions divided by Sessions). (source: definition in GA4 UI)
Conversions
These are not immediately useful if we mean to duplicate Universal Analytics reports in App+Web: Conversions are a count of events marked as Conversions, not deduplicated on session level (so it is not really a session-scope metric). What is more, right now there is no way to specify which conversion we want to view — they are all thrown into the same pot. The most likely use case is when we only track a single Conversion event — then the report will be more meaningful. (source)
GA4 BigQuery export schema
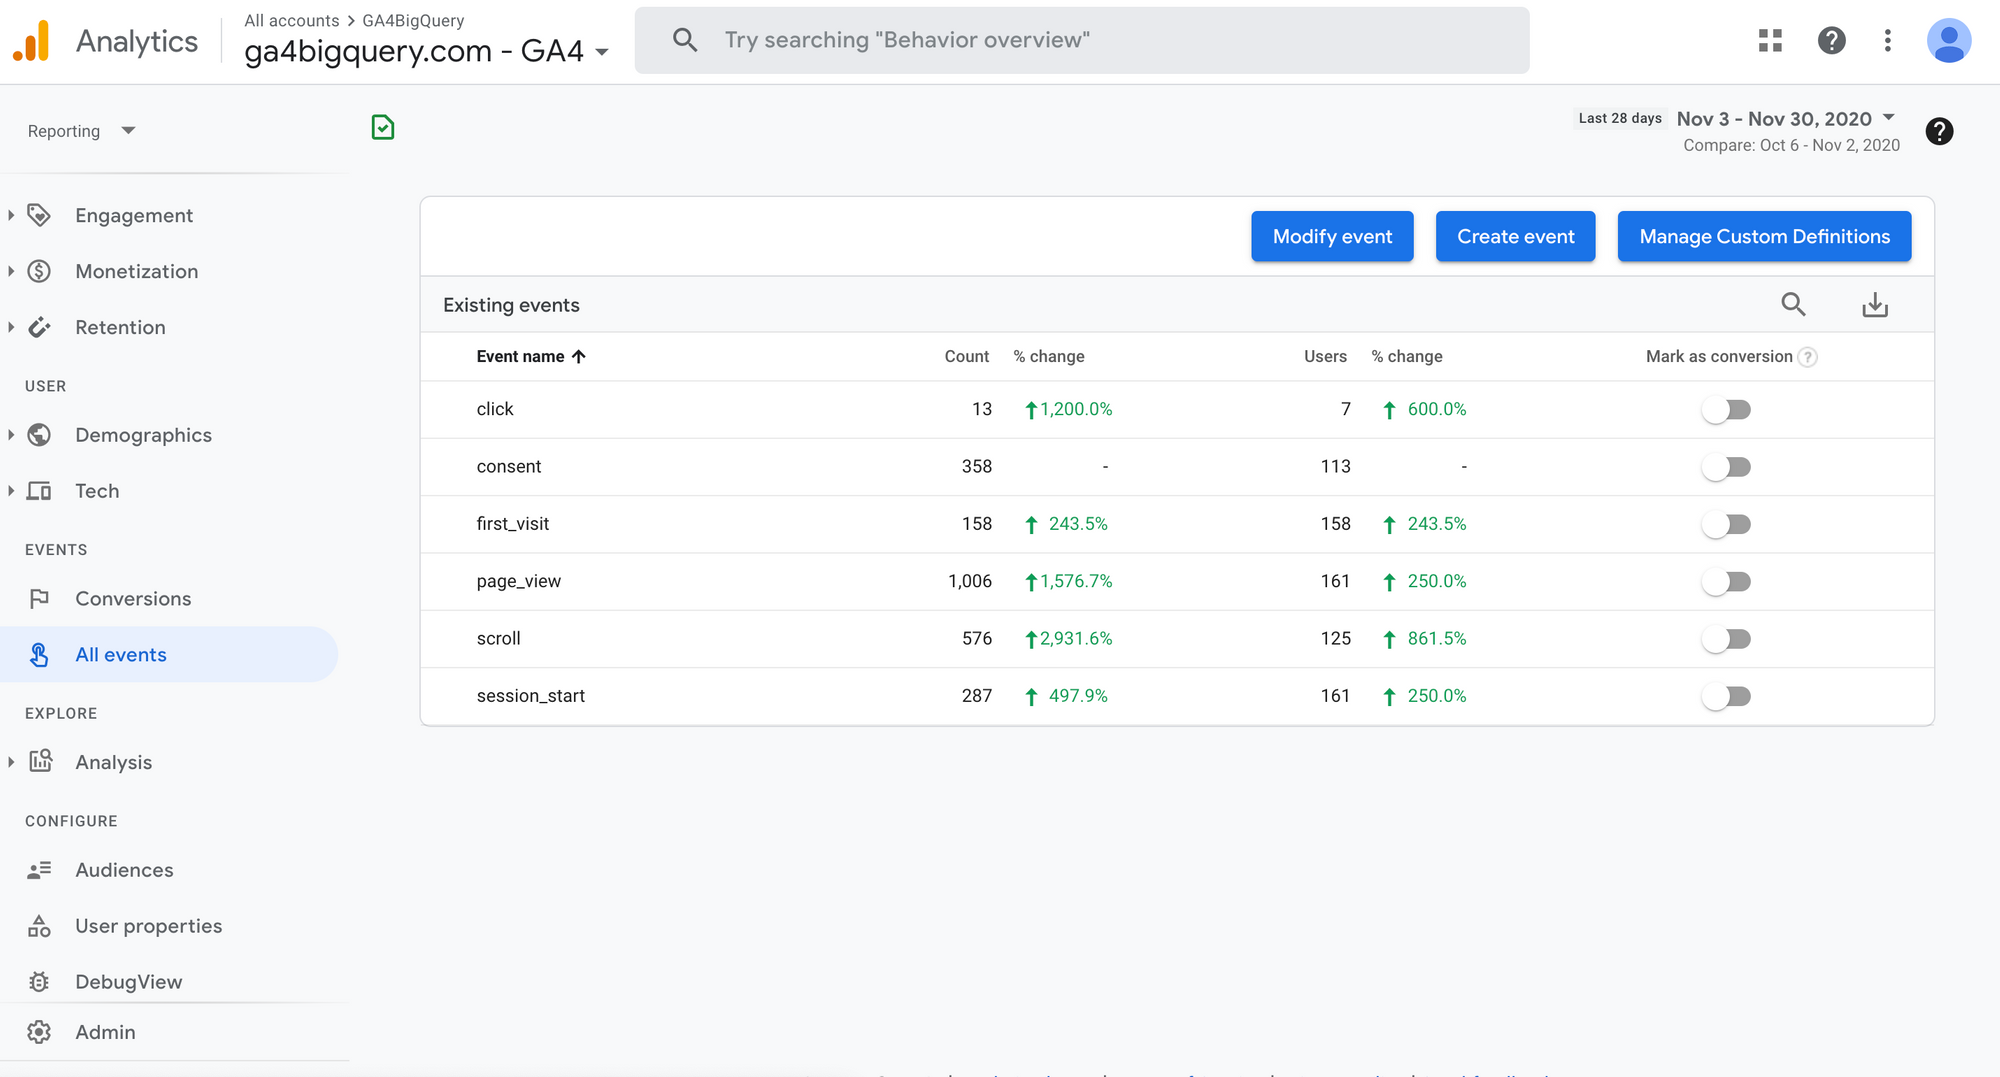
As there is no sample data set for Google Analytics 4 properties (yet?), I will use an export data set (web only) with data collected on this website. Apart from the standard events that are collected through ‘enhanced measurement’, it is possible you will see some custom event parameters in our data set. This does not impact our schema in any way.
Let’s take a look at the GA4 BigQuery export schema:
As you will notice the data set is heavily organised around event and user data, supplemented with some device, geo, app and traffic source data.
Depending on various definitions, you can expect some relatively small differences between the Google Analytics 4 user interface and the results of your BigQuery export data queries. Read about differences in user counts or dimension & metric definitions.
Nested fields
In the Universal Analytics export schema, every row in the data set represents a single session. As the GA4 properties are event based, every row in our data set represents an event. Every event in turn can contain multiple event parameters and corresponding values. To show you how this works in BigQuery, we query our nested sample set:
select
    *
from
    -- change this to your google analytics 4 export location in bigquery
    `ga4bigquery.analytics_250794857.events_*`
limit
    3
This gives us the following result:
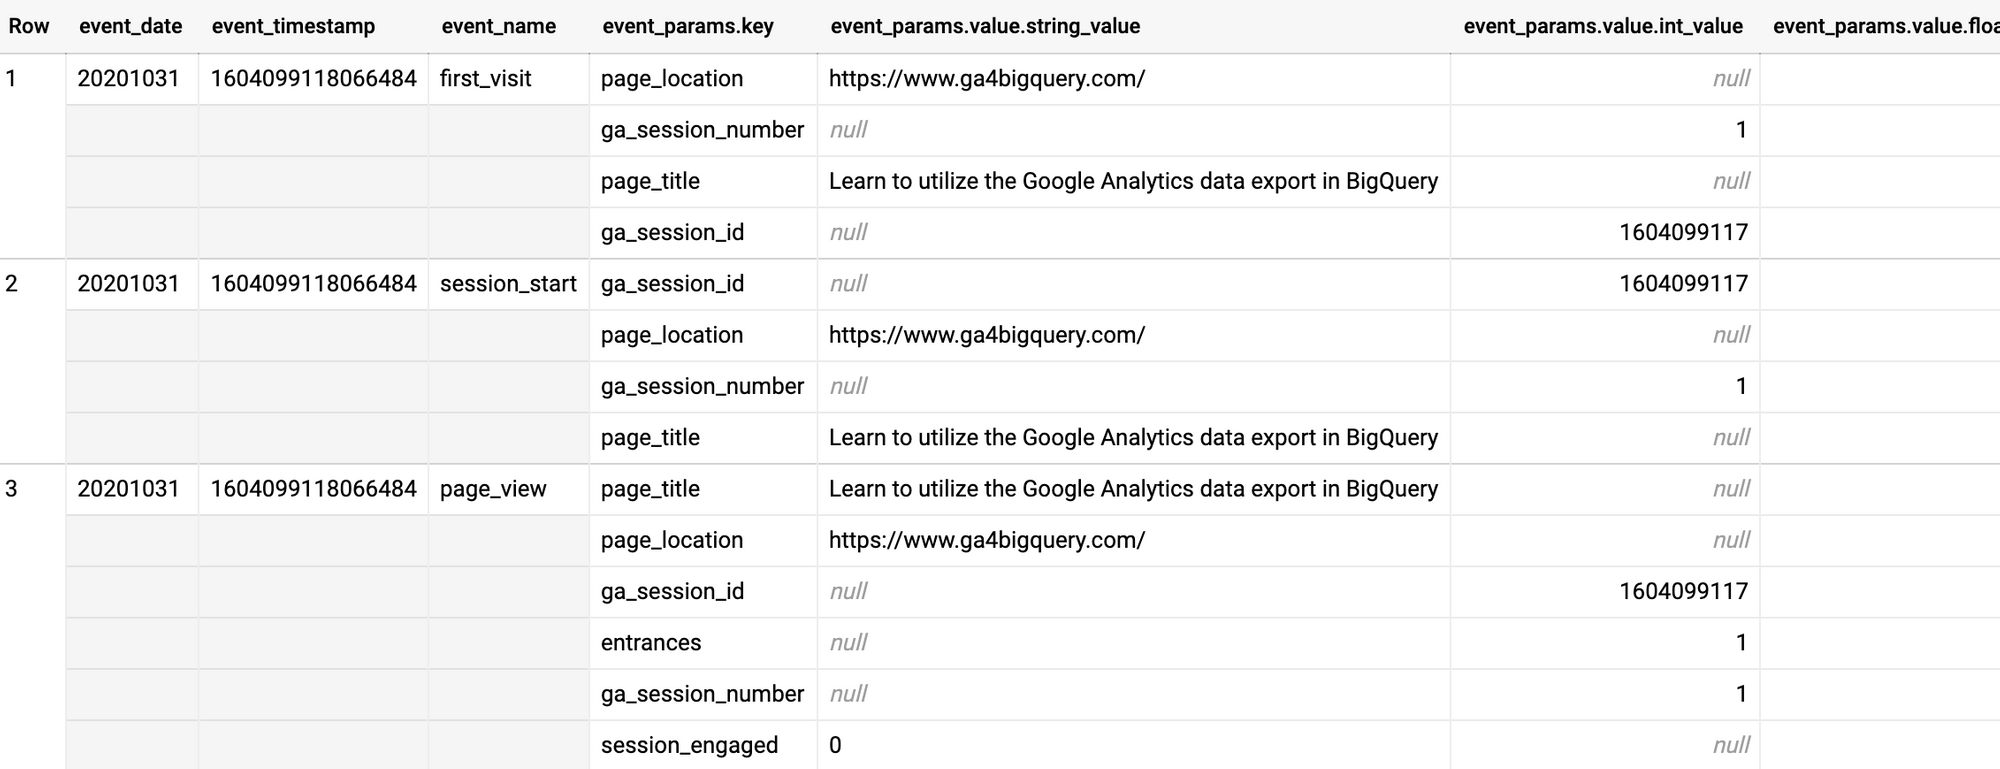
Remember, only row 1,2 and 3 in this example are real rows in our table. The other ‘rows’ are in fact nested fields, in most cases null values. Only the event.params columns are populated with values.
To deal with this fields and to be able to query our tables so they meet our needs, we need the unnest function.
The problem here is that is essentially an array (actually in BigQuery parlance it’s a “repeated record”, but you can think of it as an array). (…) This is where the UNNEST function comes in. It basically lets you take elements in an array and expand each one of these individual elements. You can then join your original row against each unnested element to add them to your table. (source)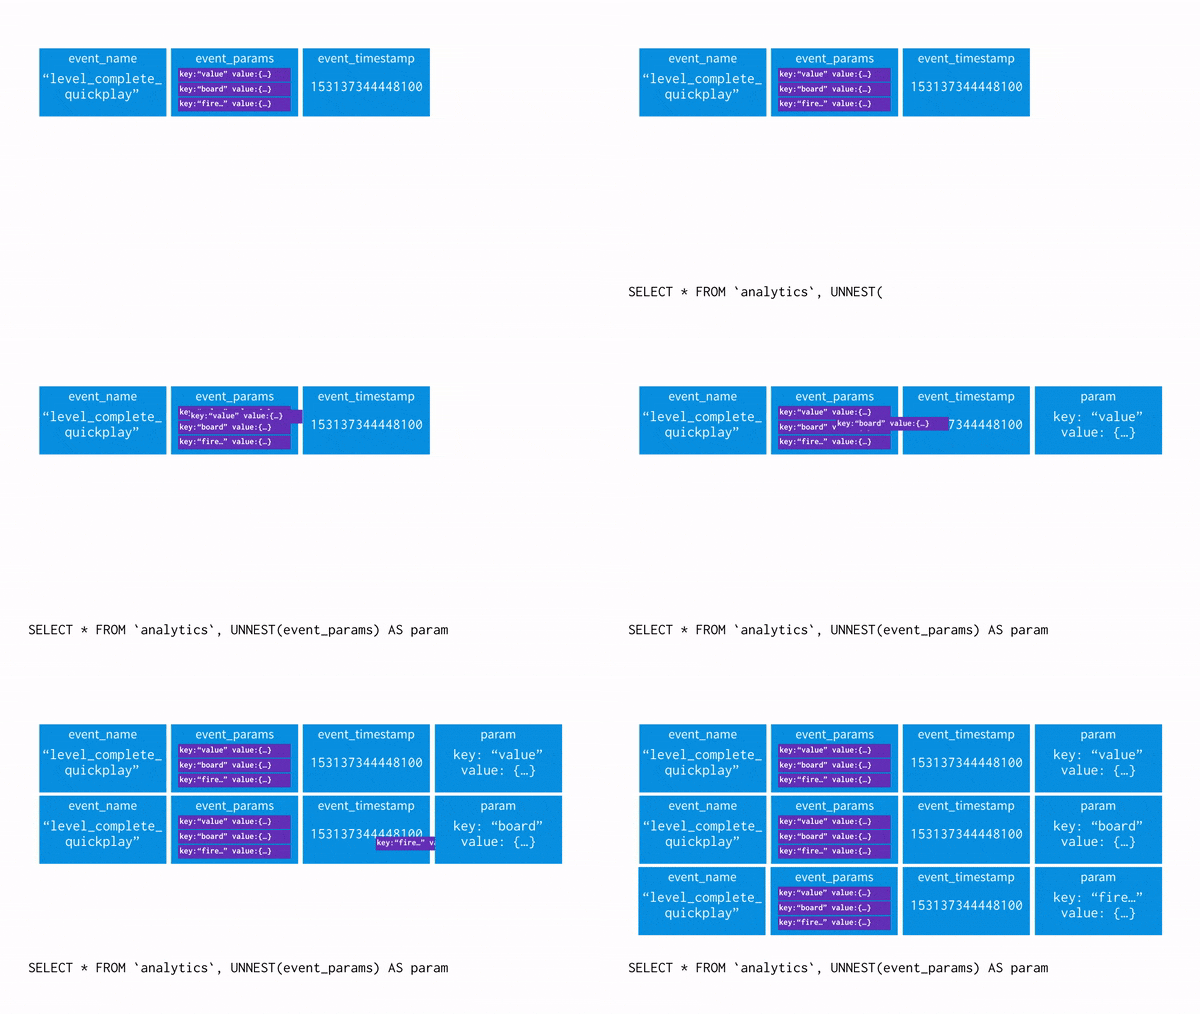
I highly recommend reading this article which explains the unnest concept in detail with the Firebase Analytics sample data set as an example.
You only have to unnest records that contain ‘repeated fields’. In case of our Google Analytics 4 data set these could involve:
- event_params
- user_properties
- items
Do you need to leverage your GA4 data outside of BigQuery? Then you might be interested in this tutorial:
Get all unique events and parameters
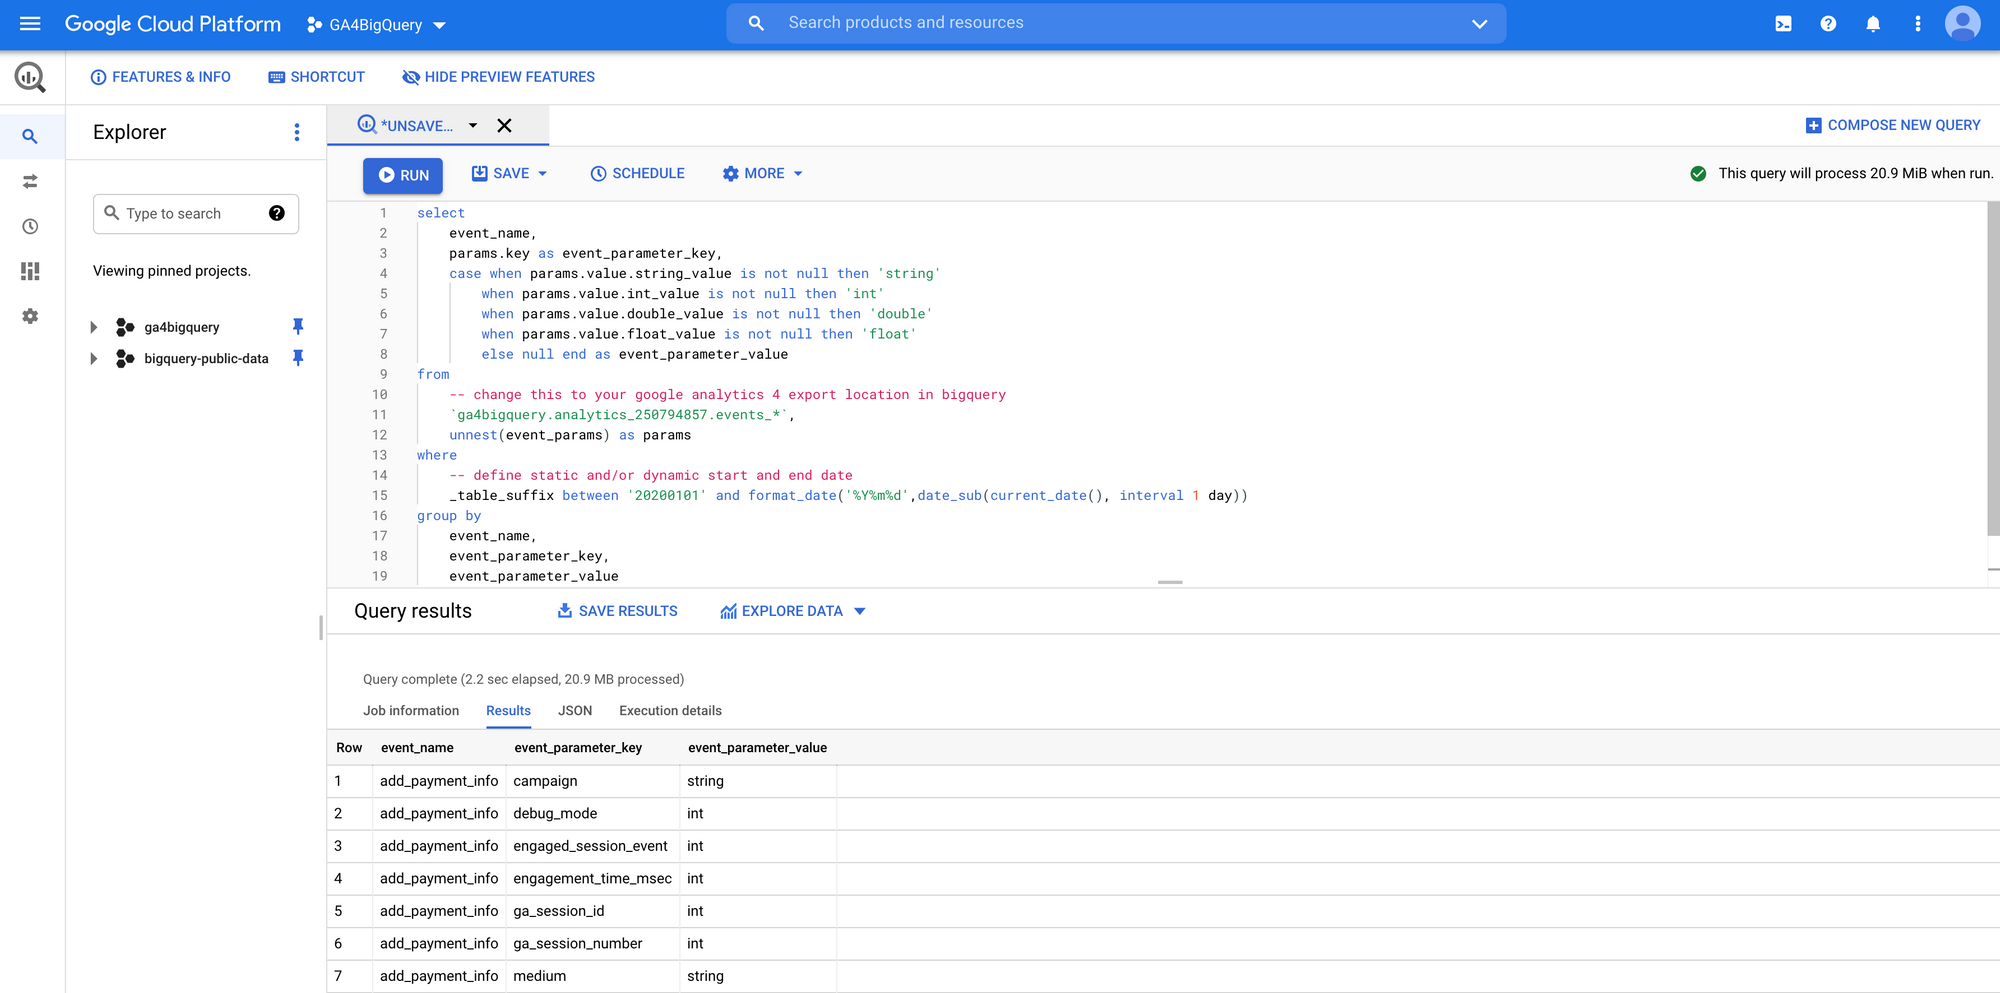
As every data set can and will contain different events and event parameters with different data types, it is very helpful to query the actual tables to find out. Especially when you lack documentation about the way data is collected. To get all unique events and parameters you can use a query like this:
select
    event_name,
    params.key as event_parameter_key,
    case when params.value.string_value is not null then 'string'
        when params.value.int_value is not null then 'int'
        when params.value.double_value is not null then 'double'
        when params.value.float_value is not null then 'float'
        else null end as event_parameter_value
from
    -- change this to your google analytics 4 export location in bigquery
    `ga4bigquery.analytics_250794857.events_*`,
    unnest(event_params) as params
where
    -- define static and/or dynamic start and end date
    _table_suffix between '20200101' and format_date('%Y%m%d',date_sub(current_date(), interval 1 day))
group by
    event_name,
    event_parameter_key,
    event_parameter_value
order by
    event_name,
    event_parameter_key
Query inspired by Robert Sahlin
This query results in a list of all unique events and parameters with their corresponding data type. These repeated fields contain a lot of data, which we will use to calculate dimensions and metrics.
| event_name | event_parameter_key | event_parameter_value |
|---|---|---|
| click | campaign | string |
| click | engaged_session_event | int |
| click | engagement_time_msec | int |
| click | ga_session_id | int |
| click | ga_session_number | int |
| click | link_classes | string |
| click | link_domain | string |
| click | link_url | string |
| click | medium | string |
| click | outbound | string |
| click | page_location | string |
| click | page_referrer | string |
| click | page_title | string |
| click | session_engaged | string |
| click | source | string |
| consent | action | string |
| consent | campaign | string |
| consent | debug_mode | int |
| consent | engaged_session_event | int |
| consent | engagement_time_msec | int |
| consent | ga_session_id | int |
| consent | ga_session_number | int |
| consent | medium | string |
| consent | page_location | string |
| consent | page_referrer | string |
| consent | page_title | string |
| consent | session_engaged | string |
| consent | source | string |
| consent | term | string |
| first_visit | engaged_session_event | int |
| first_visit | ga_session_id | int |
| first_visit | ga_session_number | int |
| first_visit | page_location | string |
| first_visit | page_referrer | string |
| first_visit | page_title | string |
| first_visit | session_engaged | int |
| page_view | campaign | string |
| page_view | debug_mode | int |
| page_view | engaged_session_event | int |
| page_view | entrances | int |
| page_view | ga_session_id | int |
| page_view | ga_session_number | int |
| page_view | medium | string |
| page_view | page_location | string |
| page_view | page_referrer | string |
| page_view | page_title | string |
| page_view | session_engaged | string |
| page_view | source | string |
| page_view | term | string |
| scroll | campaign | string |
| scroll | debug_mode | int |
| scroll | engaged_session_event | int |
| scroll | engagement_time_msec | int |
| scroll | ga_session_id | int |
| scroll | ga_session_number | int |
| scroll | medium | string |
| scroll | page_location | string |
| scroll | page_referrer | string |
| scroll | page_title | string |
| scroll | percent_scrolled | int |
| scroll | session_engaged | string |
| scroll | source | string |
| scroll | term | string |
| session_start | engaged_session_event | int |
| session_start | ga_session_id | int |
| session_start | ga_session_number | int |
| session_start | page_location | string |
| session_start | page_referrer | string |
| session_start | page_title | string |
| session_start | session_engaged | int |
| user_engagement | campaign | string |
| user_engagement | debug_mode | int |
| user_engagement | engaged_session_event | int |
| user_engagement | engagement_time_msec | int |
| user_engagement | ga_session_id | int |
| user_engagement | ga_session_number | int |
| user_engagement | medium | string |
| user_engagement | page_location | string |
| user_engagement | page_referrer | string |
| user_engagement | page_title | string |
| user_engagement | session_engaged | string |
| user_engagement | source | string |
| user_engagement | term | string |
Now it's your turn!
I hope you've enjoyed this introduction and feel a bit more confident to utilise your own Google Analytics 4 data in BigQuery. Check out the other tutorials, learn how to query dimensions & metrics and how to replicate GA4 reports. Please let me know if you have any feedback or suggestions to improve the quality of the content.
